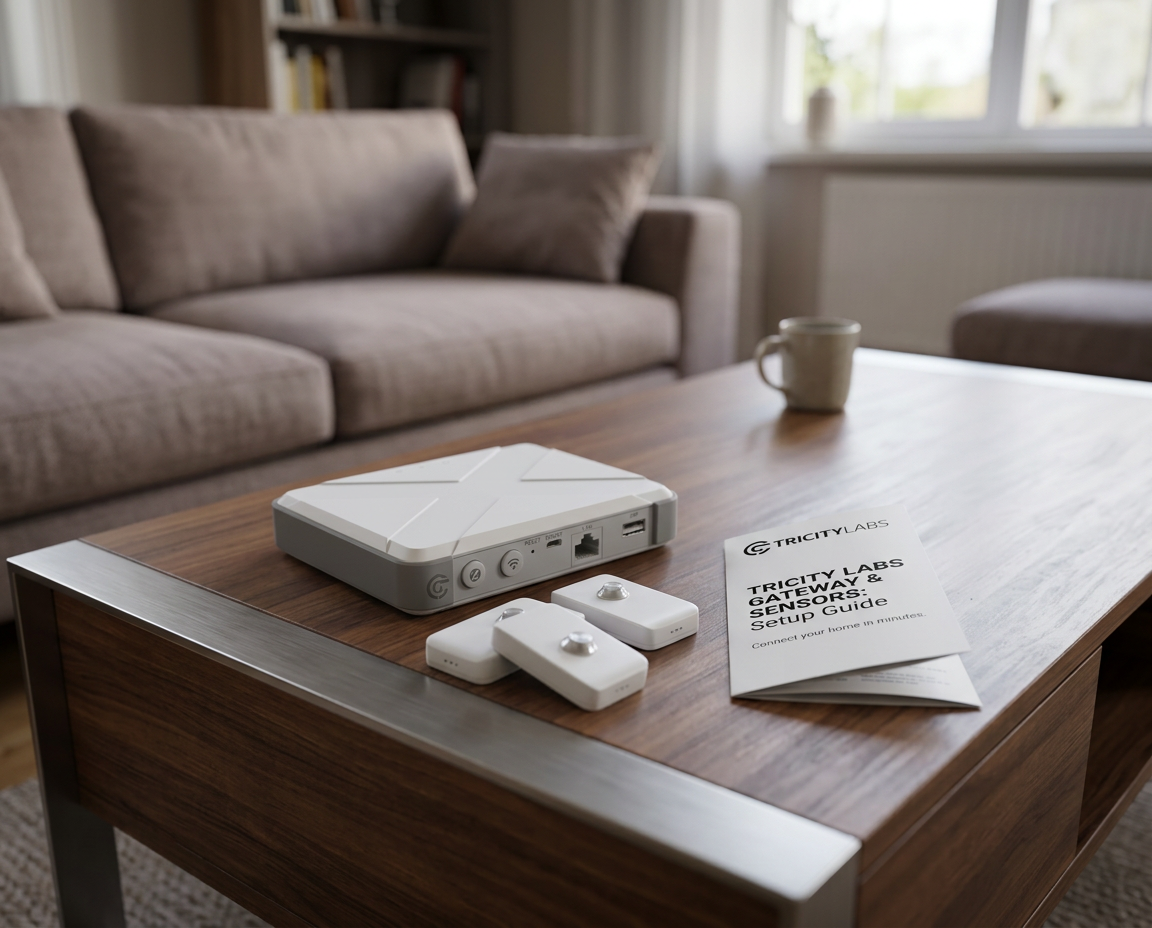
Detect. Evidence. Verify. Benchmark. Four capabilities, one platform, one sensor deployment. Here is exactly how Verity turns continuous measurement into the decisions that matter.
Every capability runs from the same sensor infrastructure. No second system, no second site visit, no separate project for each output.
Sensors continuously measure temperature, humidity, and occupancy across every connected property. When conditions cross the thresholds that indicate a welfare risk — a home below 18°C with occupancy confirmed, or humidity trending above 70% — that property is flagged.
The flag is not a diagnosis. It is a measured observation that a home warrants attention. Your resident services team receives the flag. They make the call.
Output: Welfare flags, ranked by severity. Self-refreshing as conditions change.
Every measurement is timestamped, structured, and retained. That continuous record becomes evidence — for an RSH consumer standards inspection, a Warm Homes SHF funder submission, a board paper, or a dispute over property conditions.
The evidence exists before anyone asks for it. That is the point. It does not need to be commissioned or reconstructed from memory after the fact.
Output: Structured evidence records. Formatted for RSH, Warm Homes SHF, board reporting.
A pre-retrofit baseline is established before any work begins. Measurement continues through delivery and after completion. The performance delta between pre and post-retrofit periods is the independent evidence that the intervention actually improved conditions — not modelled, not assumed.
This is what BS 40101 requires. It is also what separates a credible retrofit programme from one that cannot demonstrate its own outcomes.
Output: Pre/post retrofit M&V evidence. Independent under BS 40101.
As measurement accumulates, every connected property has a performance history. The Stock Performance Index ranks properties by measured underperformance — not by last inspection date, not by EPC estimate, but by continuous evidence of how each home actually performs.
That ranked view changes how investment decisions are made. Capital goes where evidence shows it is needed, not where assumptions say it might be.
Output: Stock Performance Index. Portfolio ranking by measured need.
A housing association with 10,000 properties cannot investigate every home every month. With Verity, it doesn’t need to.
The platform continuously monitors every connected property and surfaces the ones that genuinely need attention — ranked by measured conditions, not by which properties were last on a schedule. That changes where resident services time is spent, where asset management investment goes, and what a board can demonstrate to the Regulator of Social Housing.
From a portfolio of 10,000 homes, Verity identifies the 100 that need action this month — based on what sensors are measuring right now, not what an inspection found last year.
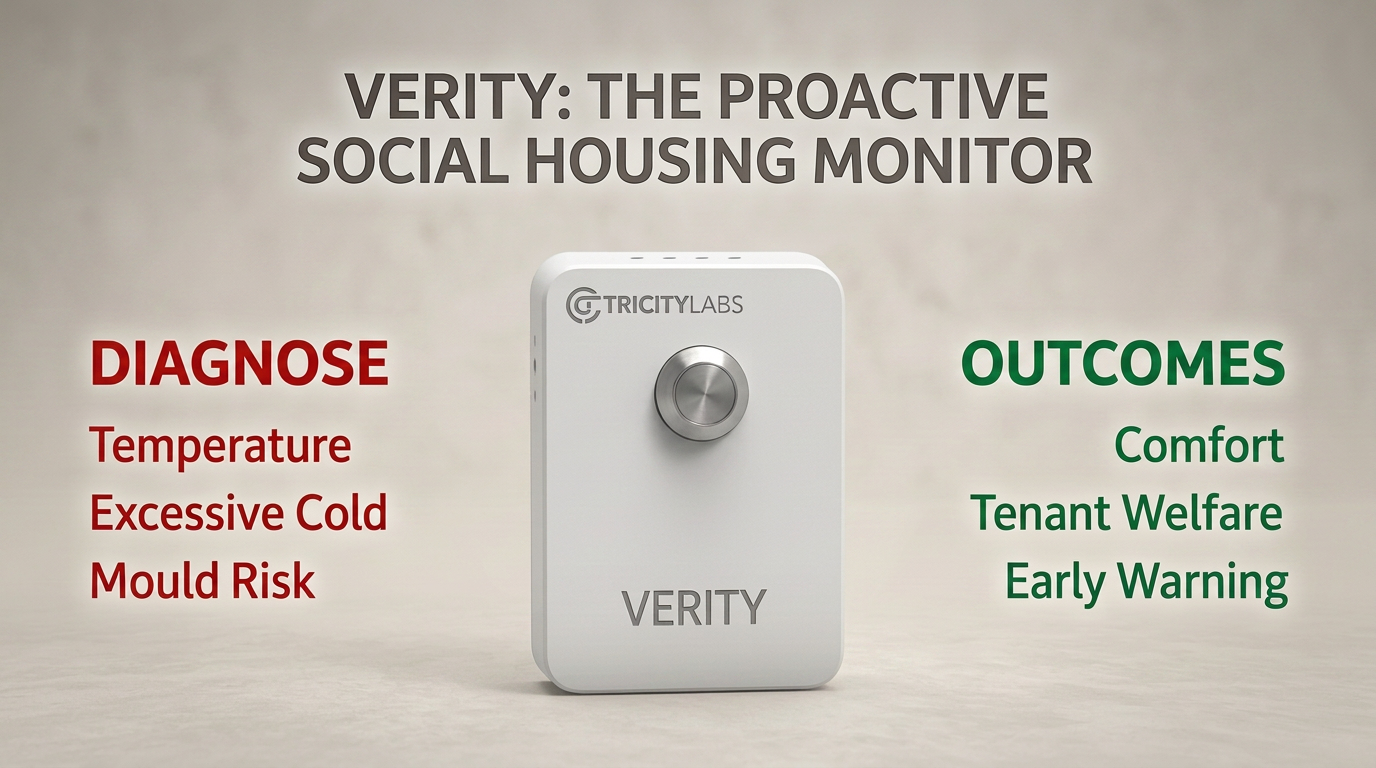
Not every property in a portfolio needs a full sensor suite from day one. Verity is designed as a two-tier system that prioritises efficiently.
Every connected property screened using existing SMETS2 smart-meter data. Pre/post retrofit baselines, weather-corrected consumption comparison, anomaly flags. Low cost. Whole portfolio.
Properties flagged by Tier 1 receive a sensor gateway — temperature, humidity, occupancy across every room. Damp and mould risk, heat-loss anomaly, heating underperformance, cold-home welfare detection. Targeted only.
Hardware goes where the data says it is needed — not as a blanket deployment across every property. That keeps cost proportionate and evidence focused.
A short conversation is enough to scope the right pilot for your portfolio.